PPU Viewer
The PPU Viewer is a collection of tools allowing you to view/edit the current state of various parts of the PPU’s memory: nametable RAM, CHR ROM/RAM, palette RAM and OAM (sprite) RAM.
All tabs share some common settings:
- Auto-refresh: Enabled by default, this makes the PPU viewer refresh at a rate of 15 FPS.
- Auto-refresh speed: Configures at what speed the PPU viewer will refresh itself (15/30/60 FPS)
- Show information overlay: When enabled, a mouse-over overlay is shown in the nametable/CHR/sprite viewers with information on the tile/sprite below the mouse cursor.
- When emulation is running, show PPU data at scanline [y] and cycle [x]: When using the auto-refresh option, this allows you to control at which point in a frame (cycle & scanline) the data is refreshed while the emulation is running. This is useful for games that perform CHR bank switching in the middle of a frame, for example.
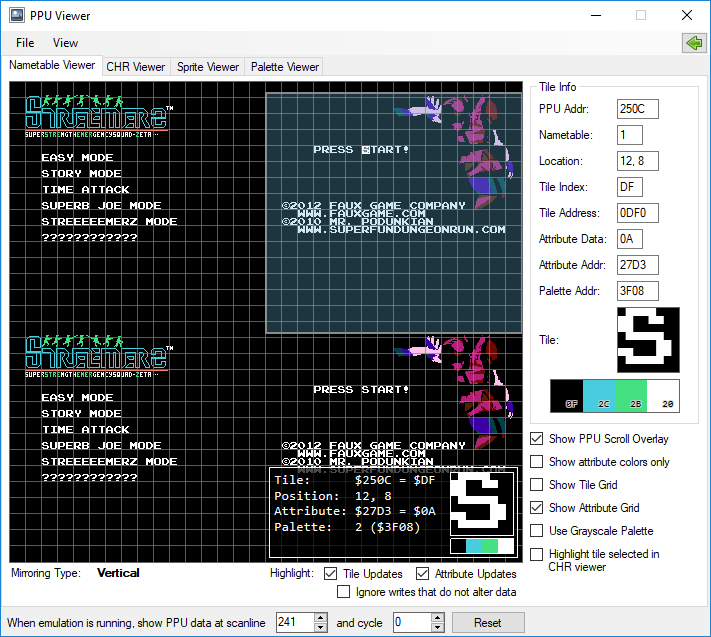
Nametable Viewer
 Nametable Viewer
The nametable viewer displays the contents of all 4 nametables (PPU addresses $2000 to $2FFF).
Mouve-over a tile to display that tile’s information on the right.
Double-click on a tile in the nametable viewer to view/edit it in the CHR Viewer.
Additionally, you can right-click on a tile to get more options:
- Edit in Memory Viewer: Opens up the memory tools at this specific tile’s location in nametable memory.
- View in CHR Viewer: Switches to the CHR Viewer and selects the tile (same as double-clicking)
- Copy Tile (HD Pack format): Copies the tile’s information (text) to the clipboard (for use with HD Packs).
- Copy image to clipboard: Copies the nametable to the clipboard.
- Export image to PNG: Exports the current nametable image to a PNG file.
There are also a number of display options:
- Show PPU Scroll Overlay: Shows a blue rectangular overlay showing the current scroll position of the screen.
- Show attribute colors only: When enabled, the viewer will show the 4 colors available in each tile, rather than the actual contents of the nametables. This can be useful when trying to debug attribute-related coloring issues.
- Show Tile Grid: Displays a 8x8 pixels red grid.
- Show Attribute Grid: Displays a 16x16 pixels blue grid.
- Use Grayscale Palette: Forces the nametables to be shown in a 4-color grayscale palette.
- Highlight tile selected in CHR viewer: When enabled, click on a tile in the CHR viewer to select it, all occurrences of that tile will then be marked by a red rectangle in the nametable viewer.
Update Highlighting
The nametable viewer can display nametable (tiles and attributes) updates by highlighting the tiles affected by the updates.
- Tile Updates: Displays a 8x8 red square overlay over tiles that have changed since the last frame.
- Attribute Updates: Displays a 16x16 yellow square overlay over attributes that have changed since the last frame.
- Ignore writes that do not alter data: By default, all memory locations written to during the last frame will be highlighted. By enabling this option, only memory locations that have changed value will be highlighted.
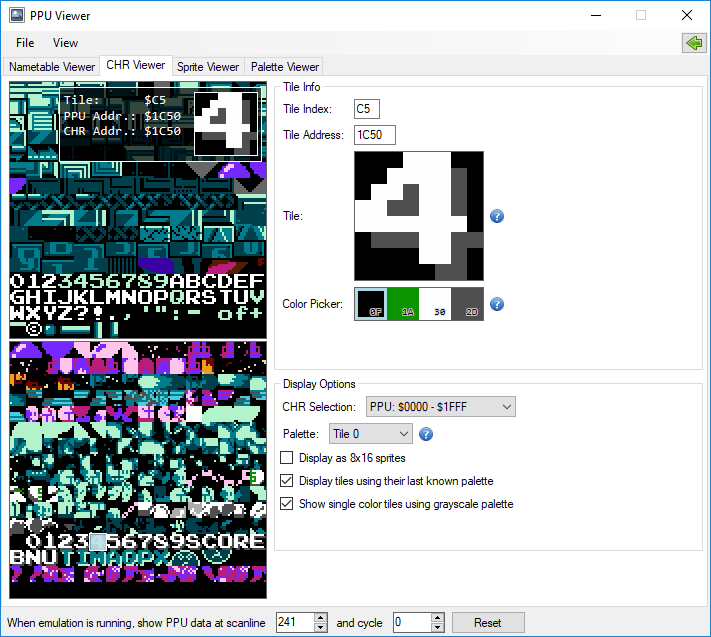
CHR Viewer/Editor
 CHR Viewer and Editor
The CHR Viewer tab displays up to 2 4kb banks of CHR data at once. It can display any portion of CHR RAM/ROM, even banks that are not currently selected.
It also doubles up as a very simple graphic editor.
You can right-click on a tile to copy the tile’s information (based on the currently selected palette) to the clipboard (for use with HD Packs).
Display Options
- CHR Selection: Select which portion of CHR memory to display in the viewer - by default, the portions of CHR memory mapped to the $0000-$1FFF range in PPU memory are shown.
- Palette Selection: Selects which palette to use to render the tiles - the first 4 palettes are for tiles, the last 4 palettes are for sprites. There is also a 9th palette named “Grayscale” which forces the CHR viewer to display tiles in a 4-color grayscale palette.
- Highlight: This option allows tiles to be highlighted/dimmed based on the CDL file’s current data. This makes it possible to highlight/dim tiles that have never been drawn by the PPU, or vice versa. This option is only available for CHR ROM games.
- Display as 16x8 sprites: When enabled, changes the display order of the tiles to make it easier to visualize 16x8 sprites.
- Display tiles using their last known palette: When enabled, any tile that has appeared in nametable memory since the debugger was opened will be shown using their last known palette (this overrides the palette selection dropdown for those tiles)
- Show single color tiles using grayscale palette: When enabled, any tile that contains a single color will be displayed using the grayscale palette instead (this overrides the palette selection dropdown for those tiles)
Editing Tiles
To edit a tile, first click on the tile you want to edit in the left-side of the window. This will select the tile and highlight it with a transparent square.
You can select the color you want to use by clicking on the Color Picker. You can also press keys 1 to 4 on your keyboard to quickly switch between the four colors.
With a tile selected, move your mouse to the tile preview above the Color Picker and click+drag to start drawing. Right-click can be used to draw as well – it always draws color #0.
Any change will remain in effect until a power cycle. If you want to save your modifications to a .nes file, or as an IPS patch, you can use the File→Save or File→Save edits as IPS commands in the debugger window. Keep in mind that edits done to CHR RAM cannot be saved.
Sprite Viewer
The Sprite Viewer displays the contents of OAM RAM. Mouve-over a sprite to display that sprite’s information on the right.
The Screen Preview displays all sprites as they will be shown on the screen, based on the current OAM data.
Like the nametable viewer, double-click on a tile to view/edit it in the CHR Viewer – this works in the Screen Preview as well.
Additionally, you can right-click on a tile to copy the tile’s information to the clipboard (for use with HD Packs).
Display outline around all sprites in preview: When enabled, all the sprites shown in the preview screen will be highlighted by a white rectangle.
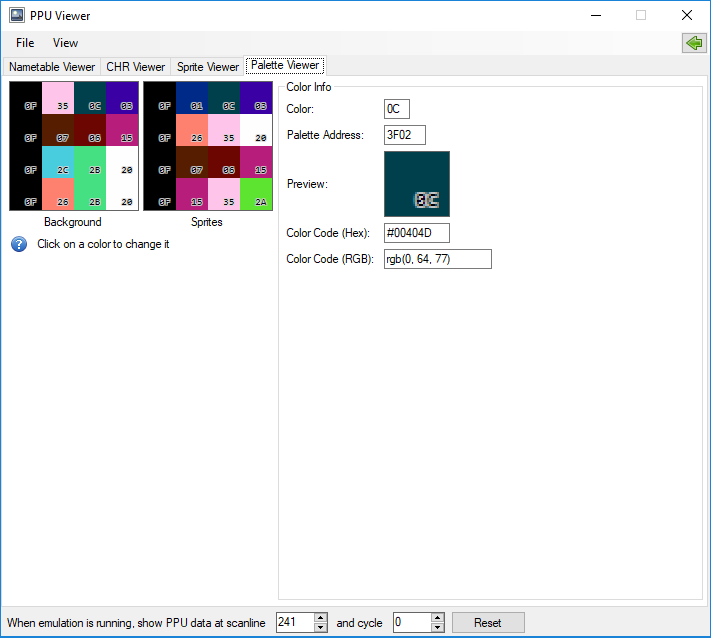
Palette Viewer/Editor
 Palette Viewer and Editor
The Palette Viewer displays basic information about the current state of palette RAM.
It shows which colors are configured in each of the 8 available palettes.
You can click on any color to select another color for that slot.
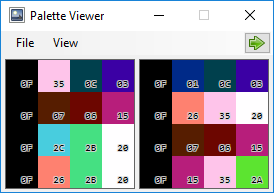
Compact View
 Palette Viewer (Compact View)
All PPU viewer tabs can be toggled to a standalone compact window, this can be done by pressing on the green arrow at the top right of the window. There is also a customizable keyboard shortcut for this (Default: Ctrl+Q) and the windows can be opened in compact mode directly using keyboard shortcuts or the PPU Viewer (Compact) menu in the Tools or Debug menus.
The compact viewers save their own position independently from the regular full-sized PPU window.
Zoomed View
In addition to the compact view, it’s also possible to double the size of the viewers by clicking on the 2x button next to the compact view button at the top right of the window. There is a shortcut for this as well (Default: Ctrl+W).